Talk to an expert
Portal
Talk to an expert
  • Home
  • Products
    • Logic+ Software
    • SMART Technology
  • About
  • Contact
  • Home
  • Products
    • Logic+ Software
    • SMART Technology
  • About
  • Contact

How can we help you?

Overview

7
  • Settings
  • Analytics
  • Delay Analysis
  • Logic+ Toolbar
  • Gantt
  • List of Schedules
  • Schedule Viewer

Project Setup

5
  • Logic+ Schedule Analysis Tool
  • Schedule Files
  • Select Baseline
  • Name Your Project
  • Project Setup Wizard

Schedule Viewer

7
  • Delay Analysis
  • Activity Details
  • Activity History
  • File History
  • Project Schedule Files
  • Enterprise Project List
  • Using Logic+ to Import and Analyze Schedule Files

Gantt

8
  • Gantt Labels
  • Columns
  • Zoom
  • Sort
  • Date
  • Group
  • View
  • Gantt View

Traceback

9
  • Traceback Settings
  • Delay Analysis Menu Options
  • Candidate Score Categories and Descriptions
  • Additional Traceback Options
  • Analyse different activity
  • Generate alternate critical path
  • Critical Path Candidates
  • Traceback Analysis
  • Running a Traceback

Delay Analysis

2
  • Delay Charts
  • Delay Analysis Menu Options

Analytics

3
  • Analytics Reports
  • ChartViewer Options
  • Accessing the Analytics Menu

Settings

2
  • Traceback settings
  • Navigation

License Information

4
  • Connect with Logic+
  • Activate Logic+ Licence
  • Purchase Logic+ License
  • Licence Key Details
  • Home
  • Docs
  • Analytics
  • ChartViewer Options
View Categories

ChartViewer Options

< 1 min read

Chart Export Options #

After running a report, the chart can be exported to PDF, Image or Excel Sheet.

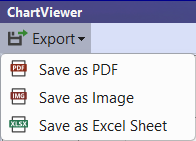
Select ‘Export’ from the top left corner then the required ‘Save as’ option:

  • Save as PDF: Save as Image: Option to save chart as PNG or JPG file.
  • Save as Excel Sheet: Exports the data used to generate the chart. Use the ‘Save as PDF’ or ‘Save as Image’ if you need the chart visualisation.

Schedule File Options #

When an analytics report is run, all schedule files that are currently open will be included in the analytics.

Use the checkboxes on the top right corner of the Chart Viewer to hide/unhide files included in the chart visualisation:
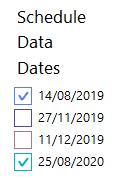
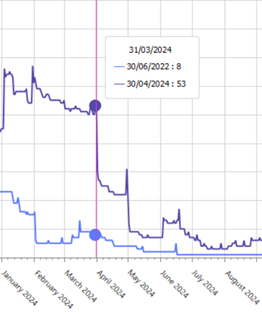
Chart Tooltips #

When viewing analytics, a tooltip will appear when you mouse hover over chart details:

Still stuck? How can we help?

How can we help?

Updated on April 28, 2025
Table of Contents
  • Chart Export Options
  • Schedule File Options
  • Chart Tooltips

Head Office

Level 7, 303 Coronation Drive
Milton QLD 4064 Australia

Home     |     Logic+ Software     |     Privacy Policy     |     Terms & Conditions     |     Documentation

© 2025 LWARE Pty Ltd  |  Digital Marketing by Focused Marketing

  • Follow