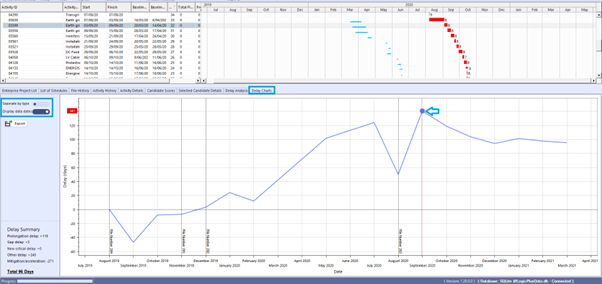
Delay Charts provide a view of the days of delay that occurred over time for the traceback path.
Charts include the Delay Activity Summary and Delay Activity by Type charts. These charts display the details from the Delay Analysis tab.
Tip: This information can also be accessed from Analytics > Delay Report. This view also shows the Delay Analysis activities at the bottom of the report.
Navigation: Bottom tab bar > Delay Charts
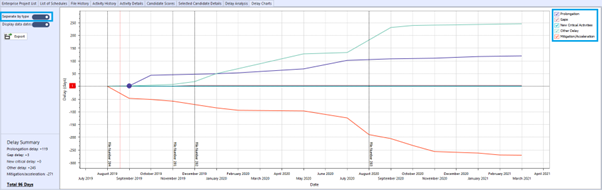
- Separate by type slide toggles between Delay Activity Summary and Delay Activity by Type chart.
- Display data dates slide shows the data date for each file included in the traceback.
- Clicking a point on either chart will sync the activity with the Gantt view.
- Use the check boxes on the Delay Activity by Type chart to hide/unhide delay activity types.
Delay Activity Summary #
Delay Activity by Type #
Traceback Settings #
Traceback settings are available to control how the traceback logic determines the critical path.
Tip: The traceback settings can only be changed when there are no active tracebacks. Select Delay Analysis > Exit Traceback first.
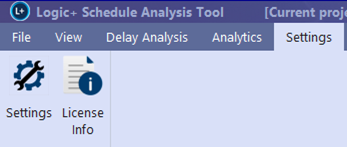
Navigation: Settings > Traceback
Details of Traceback Settings are outlined within the “Settings” Section of the Logic+ Product Guide.